CO₂ emissions control based on actual fuel consumption
Accurate CO₂ calculation based on direct fuel consumption measurement with a DFM fuel flow meter. We cut fuel consumption, prevent theft, and obtain reliable CO₂ data for reporting – all in a single solution.
Heavy machinery
Shift • machine • fleet
Remote, 24/7
A machine consuming 35–40 liters of diesel per hour emits around 1,000 kg of CO₂ over a working day.
Many countries are now introducing mandatory requirements for disclosure and reduction of CO₂ emissions:
- EU: CSRD/ESRS, ETS2 from 2027, HDV targets through 2040.
- USA: EPA HDV Phase 3, investor demands on climate risk disclosure.
- Asia: ISSB-aligned standards (JP/SG/HK/KR) from 2025–2026.
- Latin America: Transition to mandatory disclosures (Brazil, Chile, Mexico).
Benefits of Technoton’s solution

CO₂ emissions monitoring based on actual fuel consumption
Direct measurement of fuel consumption in engine fuel lines provides high accuracy of CO₂ emission calculations and detailed breakdown by shifts, operations and operating conditions.

Remote diagnostics and optimization of machine operation
Timely maintenance, prevention of fuel system failures and optimal machine operation reduce fuel consumption and the resulting CO₂ emissions.

Data integration into GLONASS and telematics systems
Information on fuel consumption and engine operating time in different load modes is integrated into fleet management systems and the company’s analytics tools.
⚙️ How CO₂ emissions monitoring works on machinery
The key element of the system is the DFM fuel flow meter, which accurately measures fuel consumption in engine fuel lines, logs engine operating time and enables real-time CO₂ emission calculation.
Fuel consumption and CO₂ emissions data from the measuring devices are transmitted to the CANUp telematics gateway, where a report is automatically generated and sent to the cloud system UNUM IIoT (or another platform):

Fuel consumption and CO₂ emissions

Engine operating time

Engine load modes

Condition monitoring and anomaly detection
CO₂ emissions reporting in GNSS and telematics systems
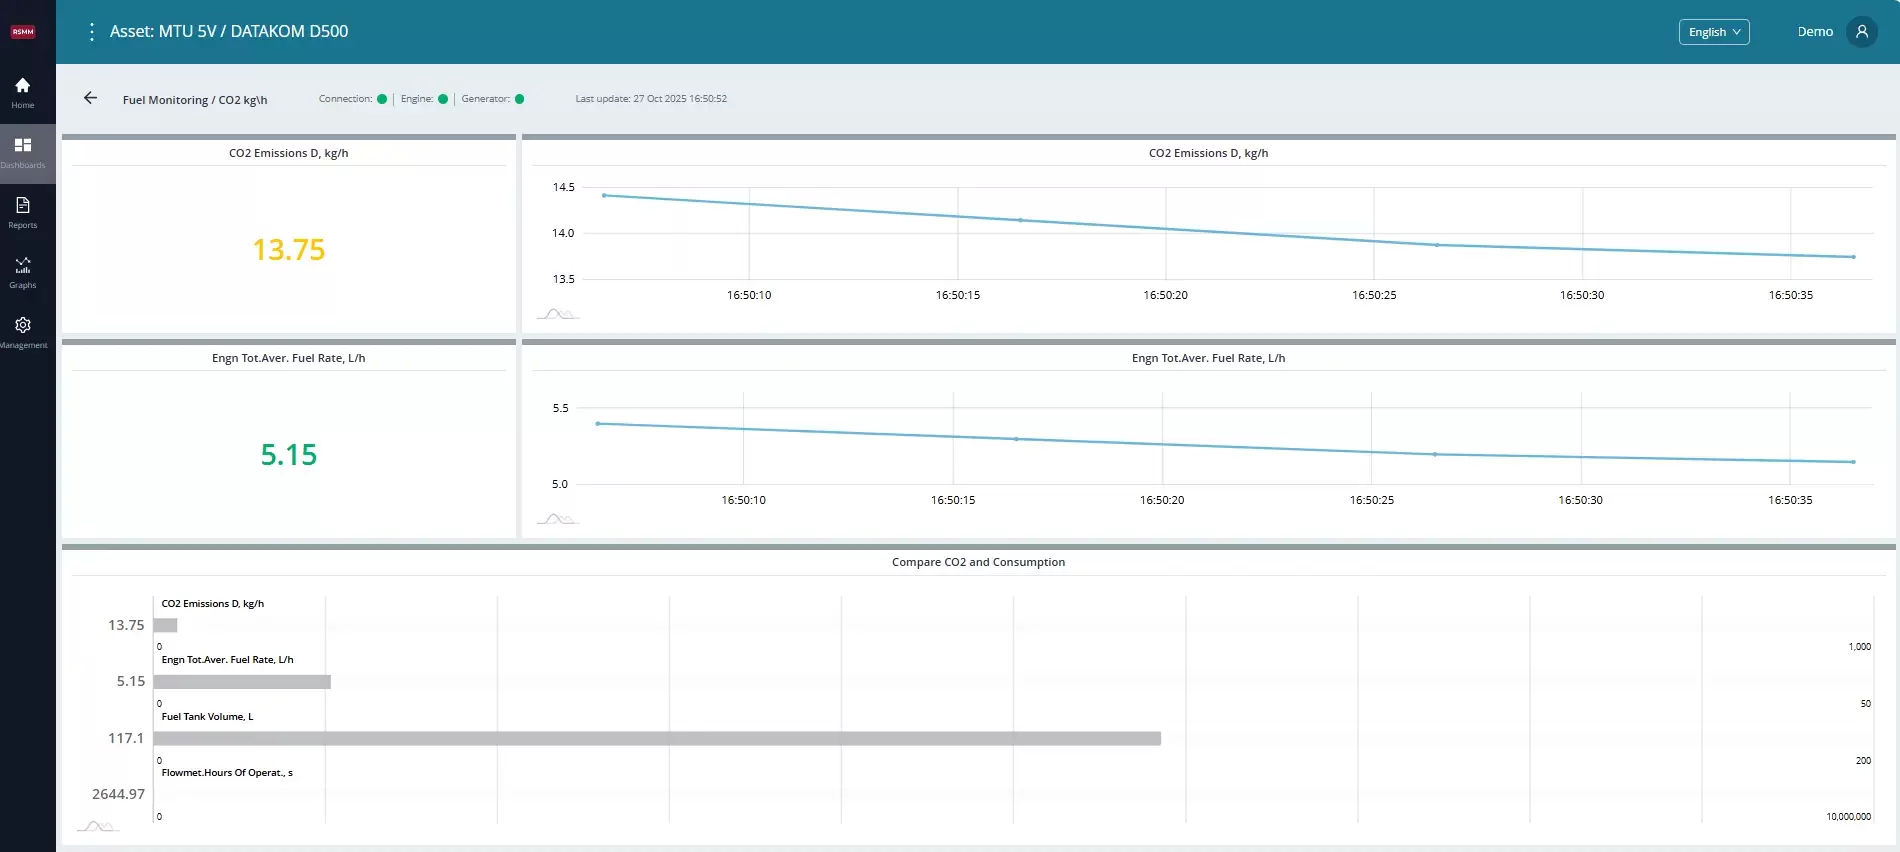
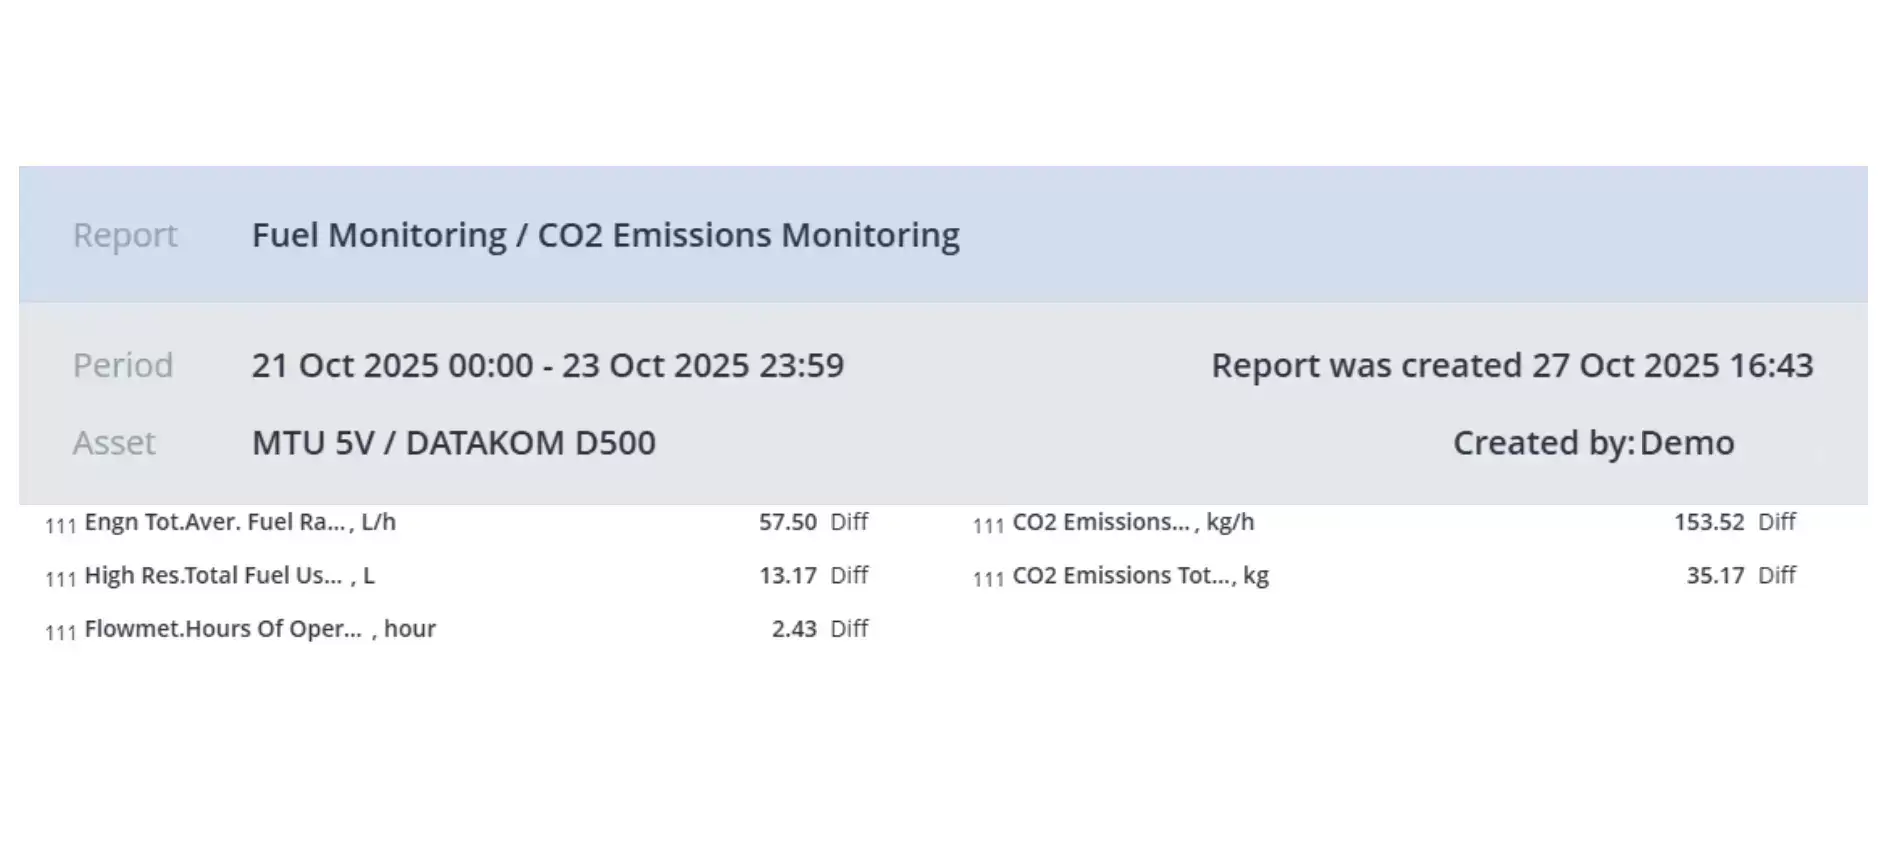
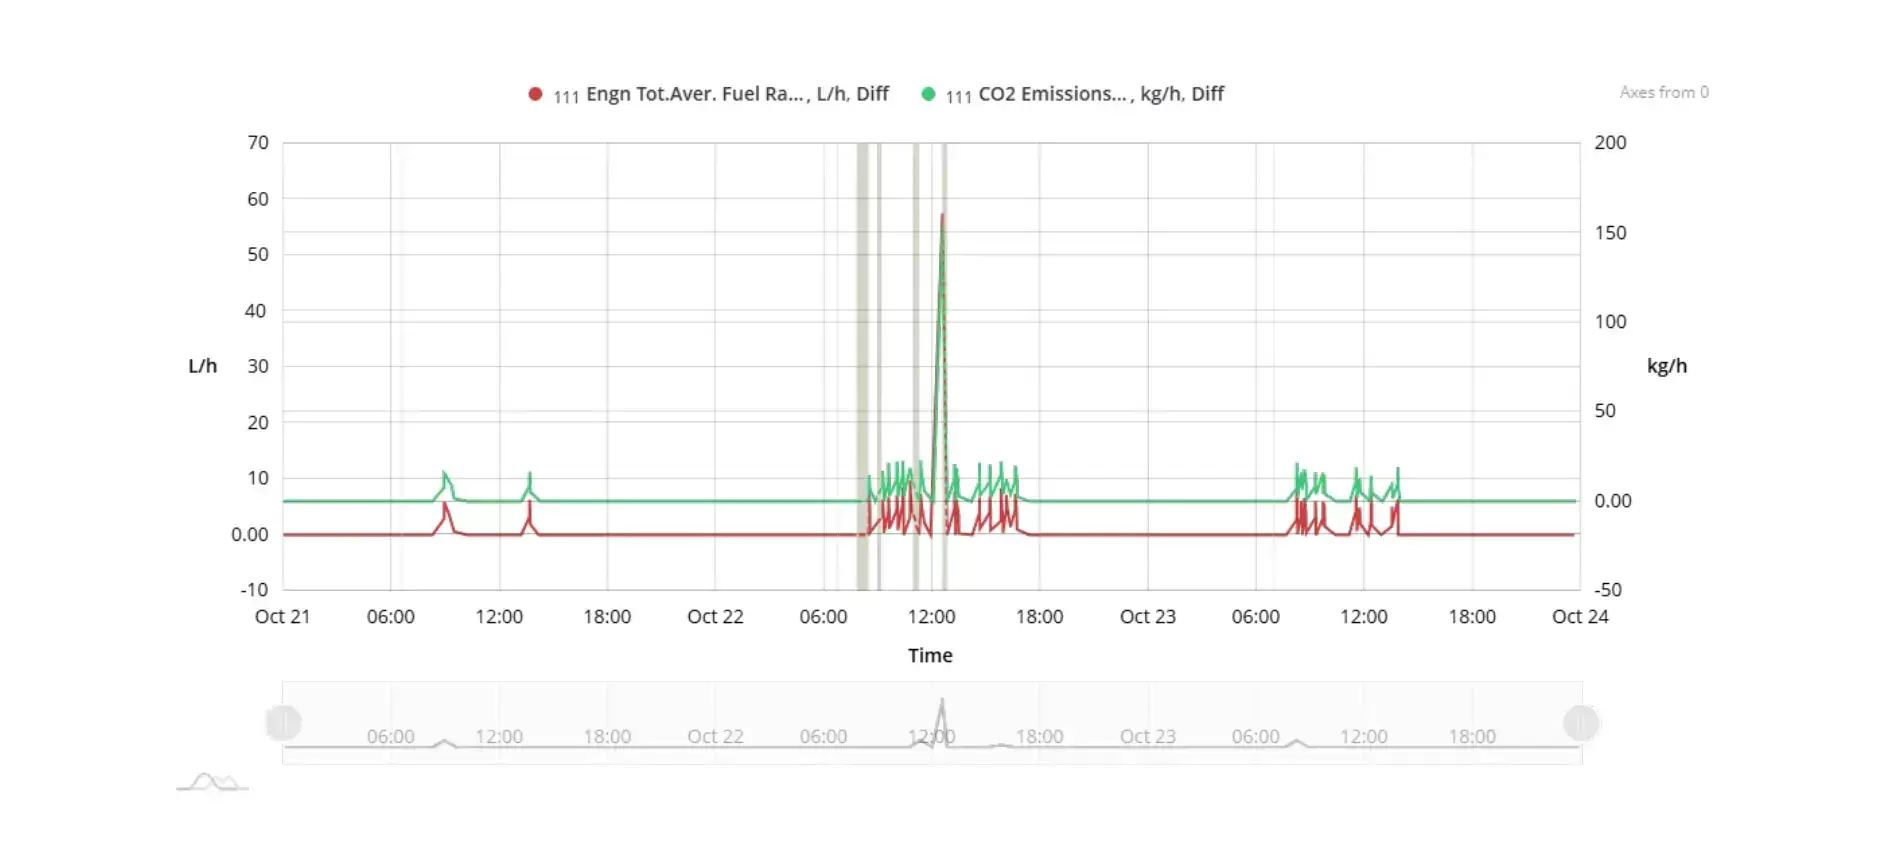
In GLONASS or telematics online software, CO₂ emission reports and charts are available, using the UNUM IIoT Solution as an example:
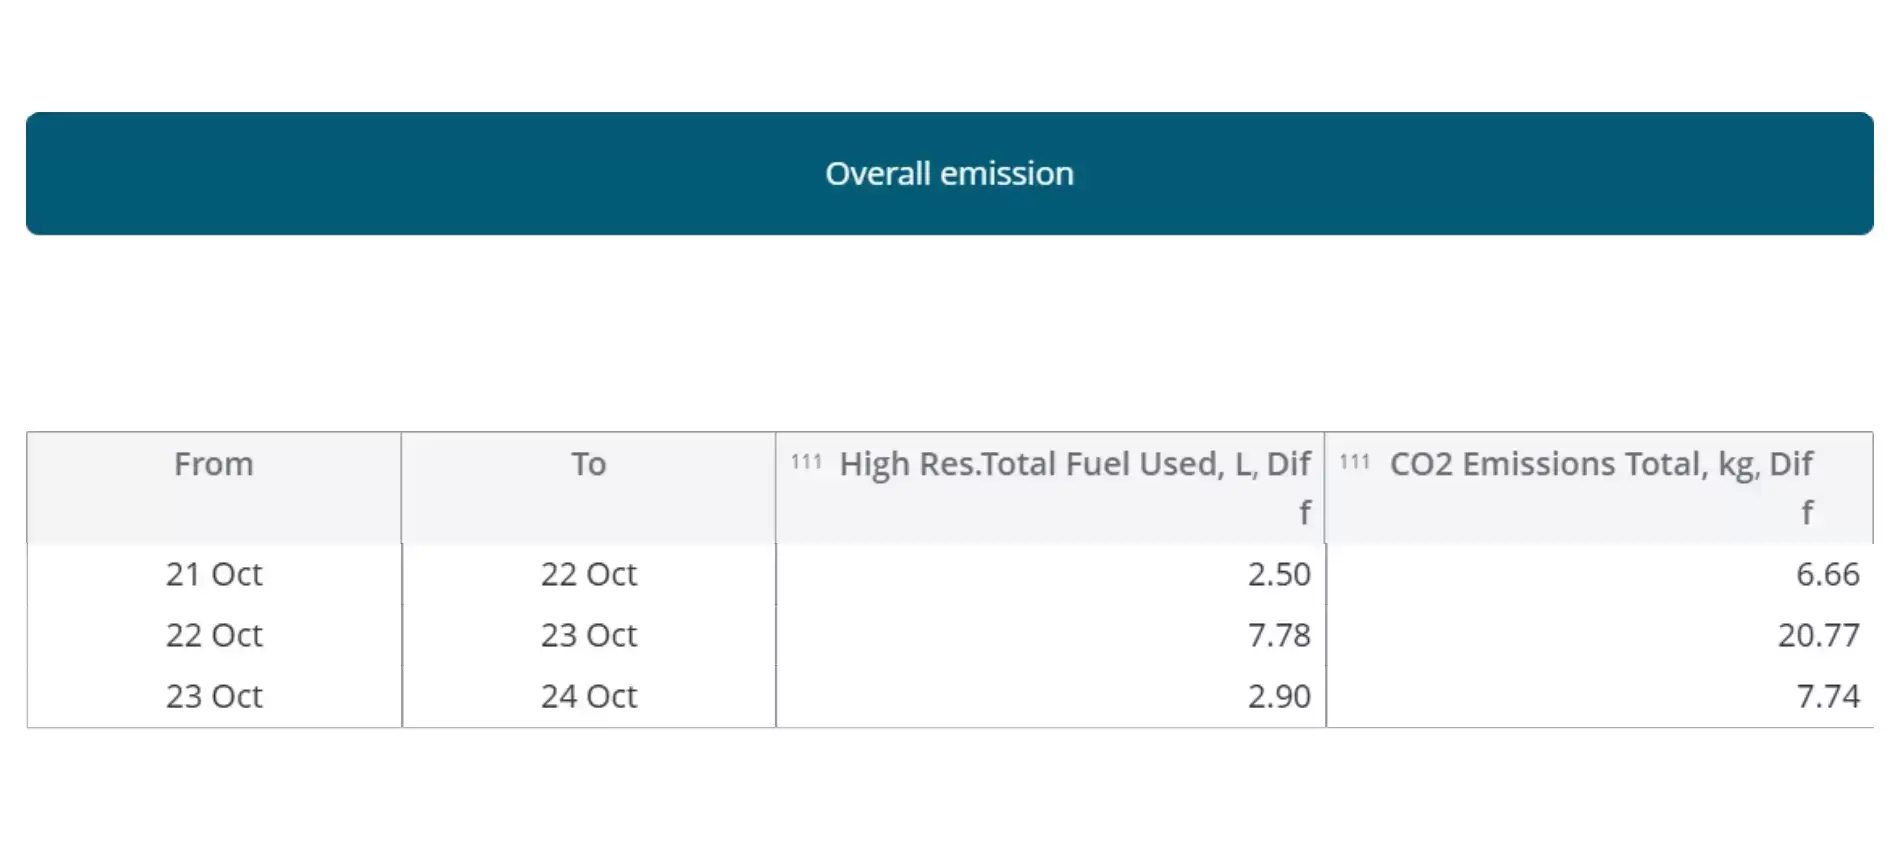
- Fleet summary report – fuel consumption, engine operating hours and CO₂ emission volume for the entire fleet over a selected period.
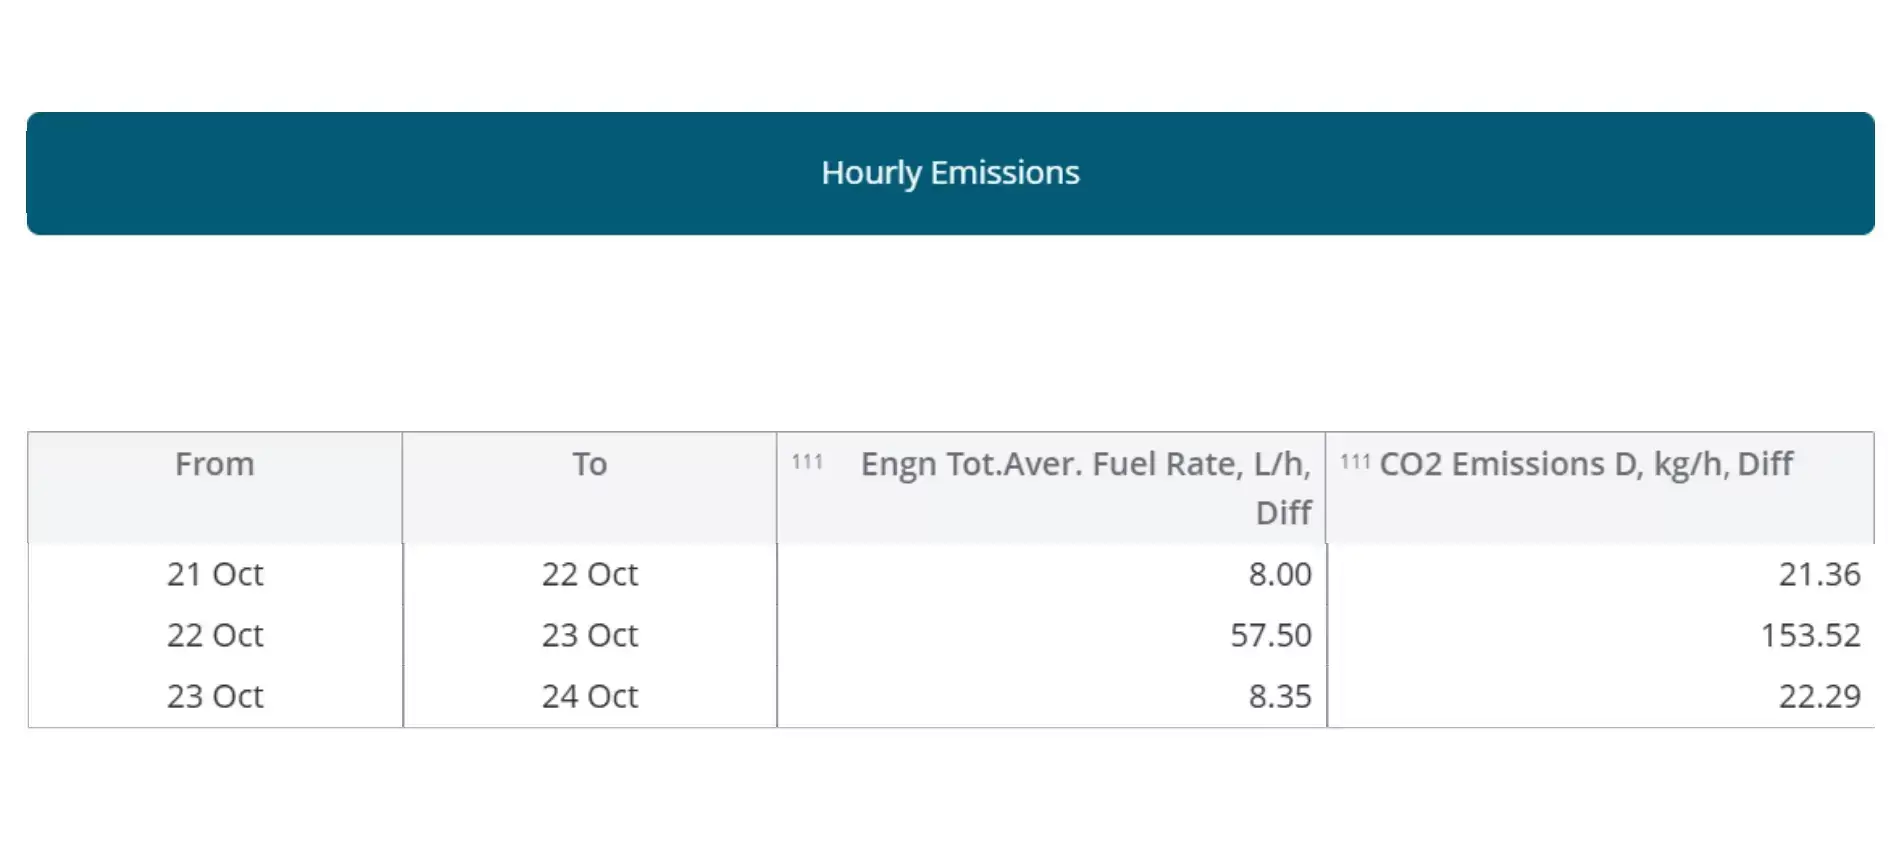
- Machine and shift reports – CO₂ emissions broken down by individual machines, trips and engine load modes (idle, optimal, overload).
- Emission structure charts – comparison of departments and sites, share of idling and overload in total emissions.
Typical CO₂ emissions monitoring scenarios
Technoton’s solution is relevant for all types of diesel-powered machinery, and especially for machines with high fuel consumption, complex operating modes and strict CO₂ emission reporting requirements.

Mining machinery
Machines operate in harsh conditions with variable loads, and fuel consumption is unstable. Equipment is used around the clock in shifts.
Scenario: sand hauling by dump truck – CO₂ emissions per ton of cargo
- Equipment: mining dump truck with 30 t payload.
- Route: quarry → concrete plant, 12 km one way (24 km per trip).
- Fuel consumption: 0.7 l/km × 24 km = 16.8 l per trip.
- CO₂ emissions: 16.8 l × 2.64 kg/l = 44.4 kg per trip.
- Per day (2 shifts, 600 tons): 370 l of fuel, 975 kg of CO₂.
- Average CO₂ emissions per ton of cargo: 975 kg CO₂ ÷ 600 t = 1.63 kg CO₂/t.

Agricultural machinery
The same type of machine is used with different implements for specific operations. Extended idling is common.
Scenario: winter wheat seeding with a tractor – CO₂ emissions per 1 ha
- Equipment: 250 hp tractor with seed drill.
- Field: 20 ha, passes of 500 m.
- Fuel consumption: 12 l/ha × 20 ha = 240 l.
- Total CO₂ emissions: 240 l × 2.64 kg/l = 634 kg.
- CO₂ emissions per 1 ha: 634 kg CO₂ ÷ 20 ha = 31.7 kg CO₂/ha.

Vessels
Marine engines consume hundreds of liters per hour, and fleets must comply with strict international standards and environmental regulations.
Scenario: vessel berthing by tugboat – CO₂ emissions per shift and per operation
- Equipment: harbor tug with two diesel engines, 1,500 kW each.
- Operation duration: 1.2 hours.
- Fuel consumption: 600 l/h × 1.2 h = 720 l per operation.
- CO₂ emissions per operation: 720 l × 2.64 kg/l = 1,900 kg CO₂.
- Per shift (2 operations): 1,440 l of fuel, 3,800 kg CO₂.
- Per day (2 shifts): 2,880 l of fuel, 7,600 kg CO₂.

Construction machinery
Excavators and bulldozers often operate with variable power in separate work cycles, frequently in urban environments.
Scenario: asphalt paving with paver – CO₂ emissions per 1 km of asphalt
- Equipment: asphalt paver with 200 kW diesel engine.
- Section: 500 m long, 7 m wide, 0.10 m layer thickness.
- Mix mass: 840 tons at average asphalt concrete density.
- Operation duration: 5 hours.
- Fuel consumption: 50 l/h × 5 h = 250 l per operation.
- Total CO₂ emissions per operation: 250 l × 2.64 kg/l = 660 kg.
- Emissions per 1 km of asphalt: 660 kg CO₂ ÷ 0.5 km = 1,320 kg CO₂.
Select a CO₂ emissions monitoring system configuration for your machinery fleet
FAQ
Is this required by law?
In many countries, environmental reporting is becoming mandatory. Preparing for CSRD, ESRS and ISO 14064 requirements helps avoid risks and fines.
In addition, precise control of CO₂ emissions not only reduces environmental risks but also opens up new growth opportunities. Fleets that meet international reporting standards gain access to large investment projects and tenders where transparent environmental documentation is a mandatory condition for participation.
What data are needed to calculate emissions?
The DFM fuel flow meter accurately measures fuel consumption and automatically calculates CO₂ emissions.
If higher accuracy is required, an emission factor per liter of fuel can be entered manually – if an exact value is available.
What technologies are used for monitoring?
The system uses fuel flow meters, the CANUp gateway, integration with fuel accounting systems, and online software for data visualization.